 FastSeas
How FastSeas Assesses Sea State
28 October 2026
Ask a sailor what makes a passage miserable and they're unlikely to start by quoting wave heights. They'll tell you the sea was short and steep, waves were breaking over the boat all night, or they spent hours punching into the waves under engine, barely making 2 knots.
The height of the waves matters, of course. But it doesn't tell the whole story.
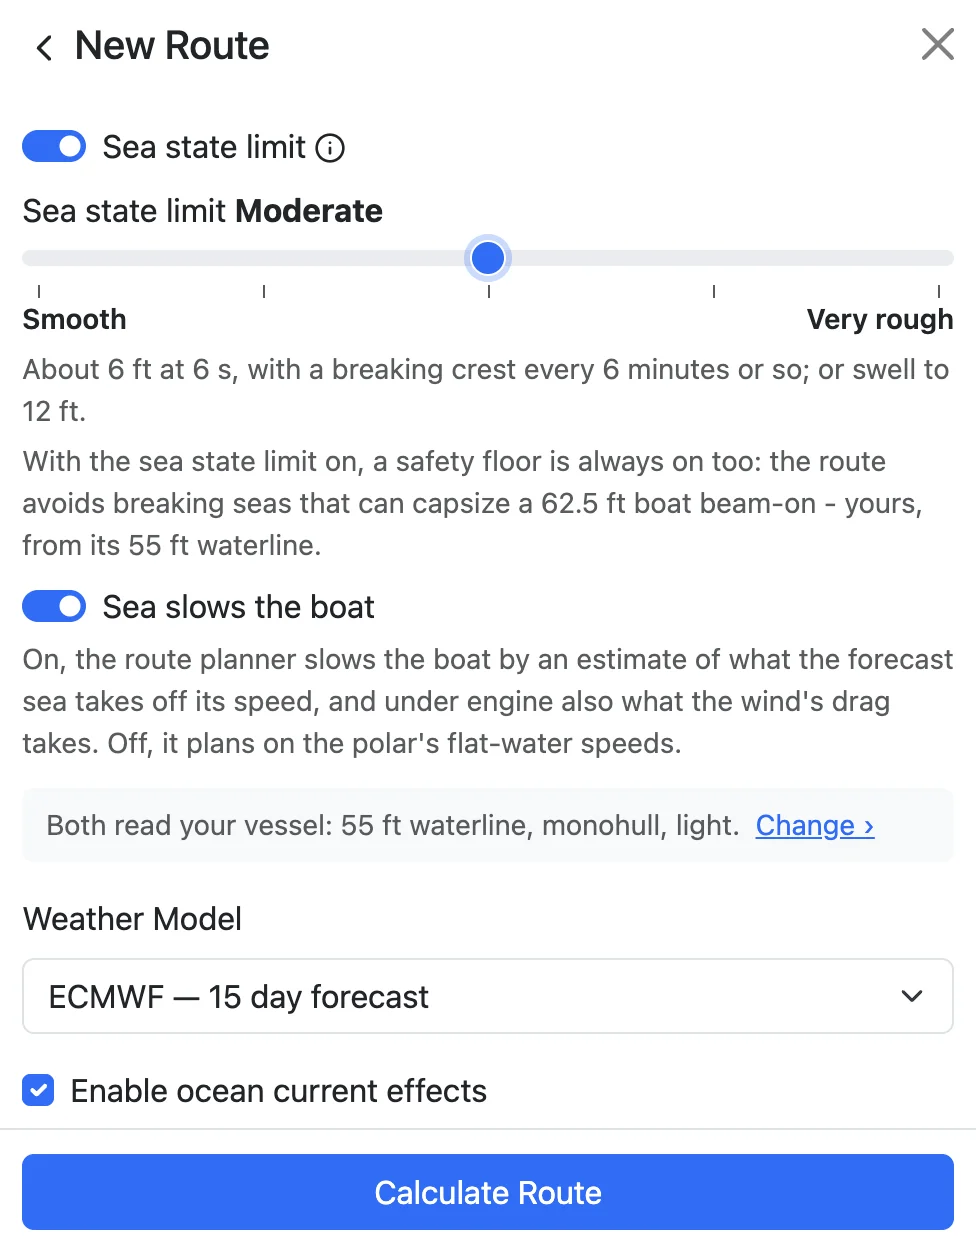
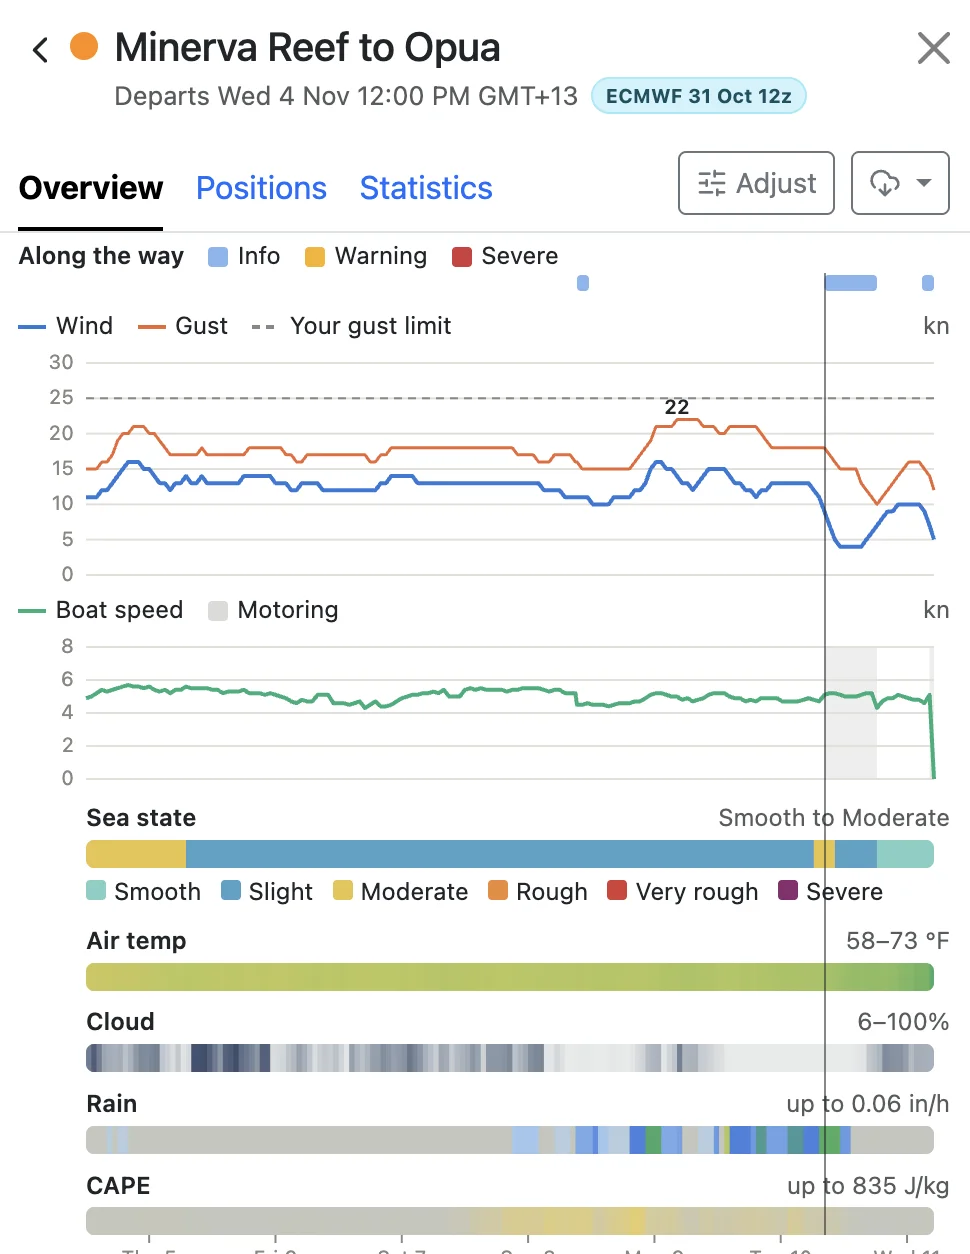
FastSeas now shows you the sea state along your route. You can set a limit to keep your route clear of seas rougher than you're comfortable with, see rough and potentially dangerous conditions highlighted in your route overview, and get an estimate of how much the sea state will slow you down.
This article explains how we assess sea state, why we've taken this approach, and what each of our sea state levels actually means out on the water.
Why Not Just a Wave Height?
The simplest limit would be a wave height. "Keep me out of anything over 2.5 m (8 ft)." We tried that idea on paper and dropped it, because the same height can be two completely different seas.
Take a 2.5 m (8 ft) swell at 14 seconds. Its crests are about 300 m (1,000 ft) apart, and it comes as a long, slow lift and fall. You notice it on the horizon and in the galley, but the boat rides over it.
Now take a 2.5 m (8 ft) wind sea at 6 seconds. Its crests are only about 55 m (180 ft) apart, less than a fifth of the swell's spacing for the same height. It's steep, it breaks, and it throws the boat about. On the beam it's dangerous.
That's why FastSeas looks at four things together.
- Height. This is the forecast's significant wave height, the average of the bigger third of the waves. It's roughly what an experienced eye would call the height of the sea. Some waves will be bigger, and over a long watch you should expect the odd one well over it.
- Period. The time from one crest to the next. At the same height, a shorter period puts the waves closer together, and that makes them steeper.
- Direction relative to your boat. A sea on the bow slows you, a sea on the beam can roll you, and a sea from astern mostly pushes you along.
- Wind sea versus swell. Wind sea is raised by the local wind. It's young, short and steep, and it's the part that breaks. Swell has travelled away from the storm that made it. It's long and smooth, and in open water it rarely breaks. Most ocean seas are both at once, a wind sea riding on a swell, and it matters a great deal which of the two makes up the height.
What the Research Says
Before we wrote any code, we went to the evidence. We read the model-tank tests of yachts in breaking waves, the inquiries into the 1979 Fastnet and 1998 Sydney Hobart races, surveys of heavy-weather accidents matched to wave forecasts, and the naval architecture of how waves slow a hull. A few findings shaped everything else.
Breaking waves are what capsize boats. After the 1979 Fastnet, tank tests caught model yachts beam-on to breaking waves. A breaker of a fair fraction of the boat's length could knock it down or roll it, and a big enough one rolled every hull tested. In the same tests, large waves that didn't break left the models upright. The height of the sea matters mainly because it sets how big the breakers are.
Steep, young seas are the ones that break. A sea that has built quickly under a rising wind is steeper than one that has had time to develop, and more of it breaks. The heavy-weather accident records point the same way. Steepness and a fast-building sea turn up in them more often than great height does.
A current running against the sea makes it worse. Waves running into an opposing current shorten and steepen. Anyone who has crossed the Gulf Stream in a northerly, or met wind against tide off a headland, knows the result.
Size matters too. The bigger the boat, the bigger the breaker it takes to roll it. A bigger boat is also slowed less by the same sea.
Our own experience on passage agrees. Big, long ocean swells do surprisingly little to your comfort or your speed. Breaking waves in open water are the plainest definition of bad conditions there is.
How It Compares With the Scales You Know
The Beaufort scale starts from the wind. Its sea descriptions, "moderate waves, many white horses" at Force 5 and "high waves, dense streaks of foam" at Force 9, describe what the wind raises on the open sea once it has blown long enough. They're a wonderful shorthand. But the sea you actually meet depends on how long and how far the wind has blown, on the swell already running, and on any current. A Force 5 that has just filled in over a long swell is not the Force 5 of the picture card.
The WMO sea state code grew out of Captain Douglas's scale of the 1920s. It's the ladder you hear in shipping forecasts, running calm, smooth, slight, moderate, rough, very rough, high, very high and phenomenal, and each word is a band of wave height. Douglas himself kept a separate scale for swell, which was exactly the right instinct. The words in today's forecasts are about height, though.
We use the same familiar words, Smooth, Slight, Moderate, Rough, Very rough and Severe, because every sailor already ranks them without reading a manual. But our levels come from the sea's height and steepness together, not from height alone. That means they won't always agree with a forecast.
A short, steep 1.5 m (5 ft) sea is moderate in a forecast. On our scale it can be Rough or Very rough, because a good share of it is breaking. A long 5 m (16 ft) Southern Ocean swell with little wind sea on it goes the other way. The WMO code calls it very rough, and on ours it's Rough. It's big, but it isn't breaking.
How We Rate a Sea
At each point of your route, the sea state level asks two questions of the sea. How much of it is breaking? And how big are the breakers?
How much of it breaks depends mostly on steepness, which is the height measured against the period. Below a certain steepness almost nothing breaks, however big the sea. Above it, the share of breaking crests climbs quickly.
How big the breakers are depends on the height. A breaking 8 m (26 ft) sea throws far more tons of water at you than a breaking 2 m (7 ft) one, and the level reflects that.
We've spaced the levels so that each step up the ladder is a real step, one you'd notice on deck, not a shade.
The level doesn't depend on your boat's size. A sea that's miserable for a 30-footer is still miserable for a 60-footer. The safety floor does depend on it. Whenever the sea state limit is on, FastSeas also keeps your route out of breakers that could roll a boat of your length beam-on, whatever level you chose. It takes your length from the waterline in Vessel Performance, so it's worth setting that to your own boat's.
Sometimes a route can't avoid a sea over your limit. Then it waits for the sea to ease, or there's no route at all. When that happens, a later departure or waiting in port may be the answer, and the overview will tell you so.
What Each Level Feels Like Aboard
The examples below are pictures of the kind of sea you can expect at each level, not exact limits, because the level depends on the mix of height, period and wind sea. The Routing tab's help line shows the sea each level allows, in your own units.
1. Smooth
Little or no breaking sea. You can cook, sleep and work on deck without thinking about it.
- A low ocean swell of about 1 m (3 ft), long and slow, with a light breeze's ripples on top.
- A 1 m (3 ft) wind sea at 6 seconds, with almost no crests breaking.
2. Slight
Comfortable sailing for most crews. You may see the odd whitecap tumble, but the boat isn't being hit.
- A 2 m (6.5 ft) swell at 14 seconds with little wind sea, in long, slow lifts. The horizon comes and goes, and the boat barely notices.
- A 1.5 m (5 ft) wind sea at 6 seconds, with a crest breaking somewhere near you every 20 minutes or so.
3. Moderate
A proper sailing day. The boat is moving about, spray comes aboard on the wind, and green-water moments are rare. Most cruising crews are happy here, though some first-timers will feel it.
- About 1.8 m (6 ft) of wind sea at 6 seconds, with a crest breaking every several minutes.
- A long 3 m (10 ft) swell with little wind sea on it. Big hills, but smooth ones.
4. Rough
Hard going. Breaking crests come regularly, and the odd one slaps the hull or comes aboard. Life below takes effort. With the sea on the bow it's slow and wet, and on the beam it's uncomfortable.
- About 2 m (7 ft) of wind sea at 6 seconds, with a crest breaking every few minutes.
- A 1.5 m (5 ft) sea at 5 seconds. The height is modest, but the sea is short and steep, the classic "short, nasty chop".
- A 5 m (16 ft) swell at 15 seconds with little on top. It's imposing, but it isn't breaking.
5. Very rough
Heavy weather for a cruising boat. A crest breaks every minute or two, and the bigger breakers are as high as a small yacht is wide. Steering, sail handling and staying aboard all take real care. Beam-on is where you least want to be.
- About 2.5 m (8 ft) of wind sea at 6 seconds.
- 1.5 m (5 ft) of short wind waves at 4 seconds. That's only a metre and a half, but about one wave in eight is breaking.
6. Severe
Anything beyond Very rough. You can't choose it as a limit, but FastSeas reports it so you know it's there. These are breaking seas big enough to damage or roll a yacht, and they call for storm tactics, not passage-making.
- A gale's sea of 4 m (13 ft) at 8 seconds, with a good share of it breaking.
- A modest wind sea running hard against a strong current, as in the Gulf Stream in a northerly.
Where the Sea Data Comes From
FastSeas reads two wave models, both on a 0.25 degree grid.
The first is NOAA's GFS-Wave (WAVEWATCH III). As well as the whole sea, it publishes the wind sea and the swells separately, each with its own height, period and direction. That's exactly what we need to judge breaking, because we can see how much of the height is young wind sea and how much is long swell.
The second is ECMWF's wave model. ECMWF's forecasts are excellent, but what it publishes openly, and free, is only the whole sea. That gives us the sea's height, its periods and its direction, and how its energy is spread across wave periods. The split into wind sea and swells is in ECMWF's complete data set, which is licensed. That licence is priced for national weather services and large companies, not for a small company like ours.
On ECMWF, then, we work out the wind sea ourselves. The spread of the sea across periods tells us roughly how much of the height sits in shorter, wind-driven waves and how much in long swell. We judge the sea state from that estimate and from the sea as a whole, and take the more cautious of the two readings. That way a steep wind sea hidden under a big swell doesn't slip through.
We checked this against GFS-Wave on the same days, since GFS-Wave does publish the split. Our estimate catches nearly all of the rough seas the split would have shown, at the cost of the occasional over-cautious call. It's still an estimate, though, and one more reason to run your route on both models and compare.
Neither model sees anything smaller than its grid, such as harbour bars, reef passes, tidal races or the sea in the lee of an island. Near the coast, use your own eyes and local knowledge.
How the Sea Slows Your Boat
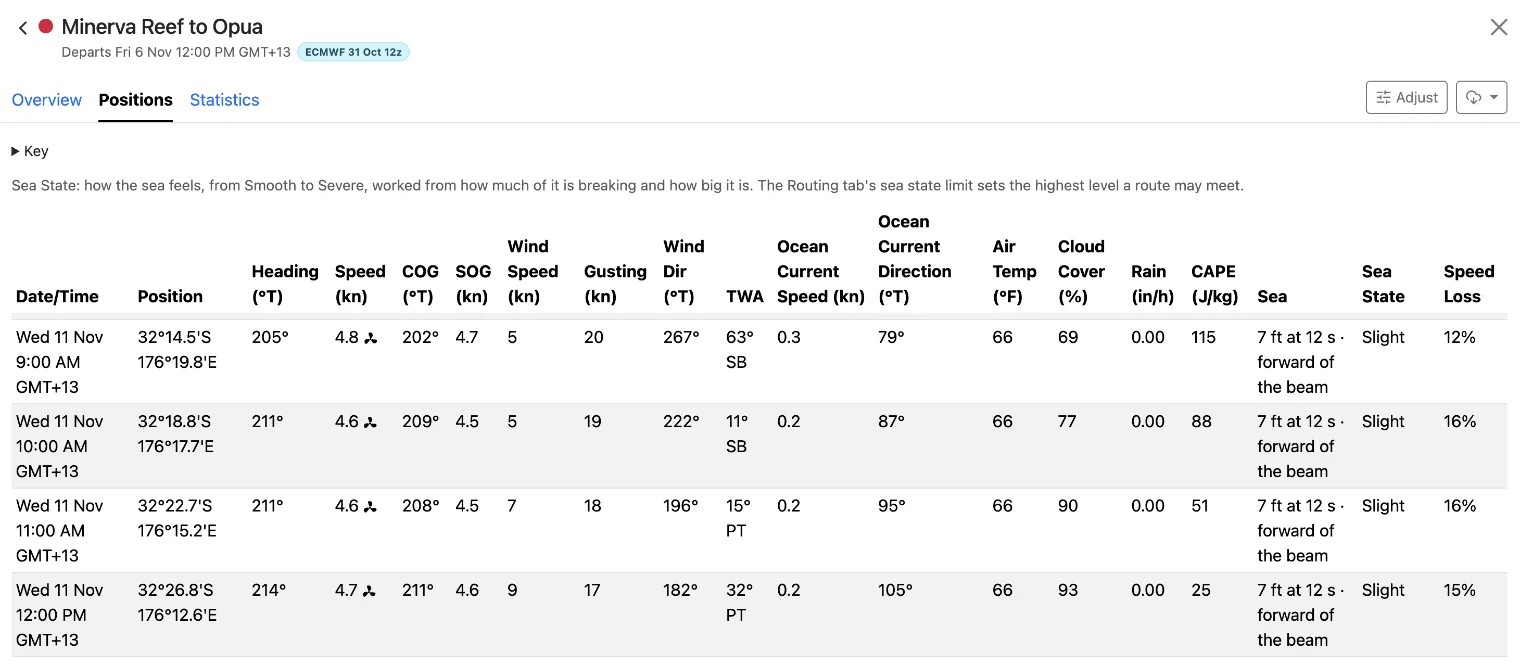
"Sea slows the boat", in the Routing tab, is on unless you switch it off. With it on, FastSeas estimates how much speed the sea takes off your boat at every step of the route, and slows the boat by that much. The Positions tab shows the figure as Speed Loss.
The estimate follows the naval architecture of a yacht in waves. It draws on tank tests of sailing yachts and on the research behind the allowances rating rules make for a seaway. Here's what it comes down to.
- Head seas cost the most. Most of the loss is the extra resistance of a hull pitching and heaving into the waves. On the beam the loss is much smaller, and from astern we take nothing off. We don't add a bonus for surfing either. We'd rather your route came out a little slow than promised a ride you may not get.
- Height counts more than you might expect. A sea twice as high costs a good deal more than twice as much speed.
- Short waves hurt more than long ones. Waves near your boat's own length do the most damage to your speed. A long ocean swell, many boat lengths from crest to crest, takes very little.
- Bigger boats lose less. Your waterline length, hull type (monohull, catamaran or trimaran) and displacement all play a part, and they come from Vessel Performance. A light, long boat shrugs off what stops a short, heavy one.
- Under engine, the wind joins in. Motoring into a head sea and a headwind together is slow, as anyone who has pushed a small boat into a short chop at cruising revolutions knows. When the boat motors, the estimate adds the wind's drag on it.
- No double charging. If your polar came from a rating certificate or your own logs, it already includes some of the sea it was sailed in. Tell us where your polar came from in Vessel Performance, and we'll allow for it so the sea isn't counted twice.
The loss runs from nothing at all, downwind or in a long swell, to well over a quarter of your speed into a short, steep head sea. These are estimates. No published model has been proven for cruising boats the size our users sail, and every boat and crew is different. If your routes come out consistently slower or faster than your boat really sails, look first at your polar and your boat's details in Vessel Performance.
In Short
- FastSeas rates the sea by how much of it breaks and how big the breakers are. It works that out from the sea's height, its period and its wind sea, not from height alone.
- The levels use the forecast's words, Smooth to Severe. But a short, steep sea can rate higher than a forecast's height band, and a long swell lower.
- With the sea state limit on, a safety floor for your boat's length is always on too.
- On ECMWF we estimate the wind sea ourselves, erring on the side of caution.
- The sea slows your boat most on the bow and in short, steep waves, and least for a big boat in a long swell.
Set your waterline, hull type and displacement in Vessel Performance, choose a sea state limit you're happy with, and run your next passage on both GFS and ECMWF to see where the hard stretches are.